

Telecom
An outage is a map problem before it is a PR problem
Subscribers do not open a ticket — they post “no signal” under your last ad, in their own language, from a specific district. Scano collects those posts across nine networks, groups them into the outage they actually describe, tells you which region is lighting up, and puts every one of them in a queue with an owner.
Personalised demo · Live on your own topics · One queue across nine networks
- from first complaint to an alert with a region on it
- Minutes
- networks in one queue, with owners and deadlines
- 9
- monitoring, so a 2 a.m. outage is not found at 9 a.m.
- 24/7
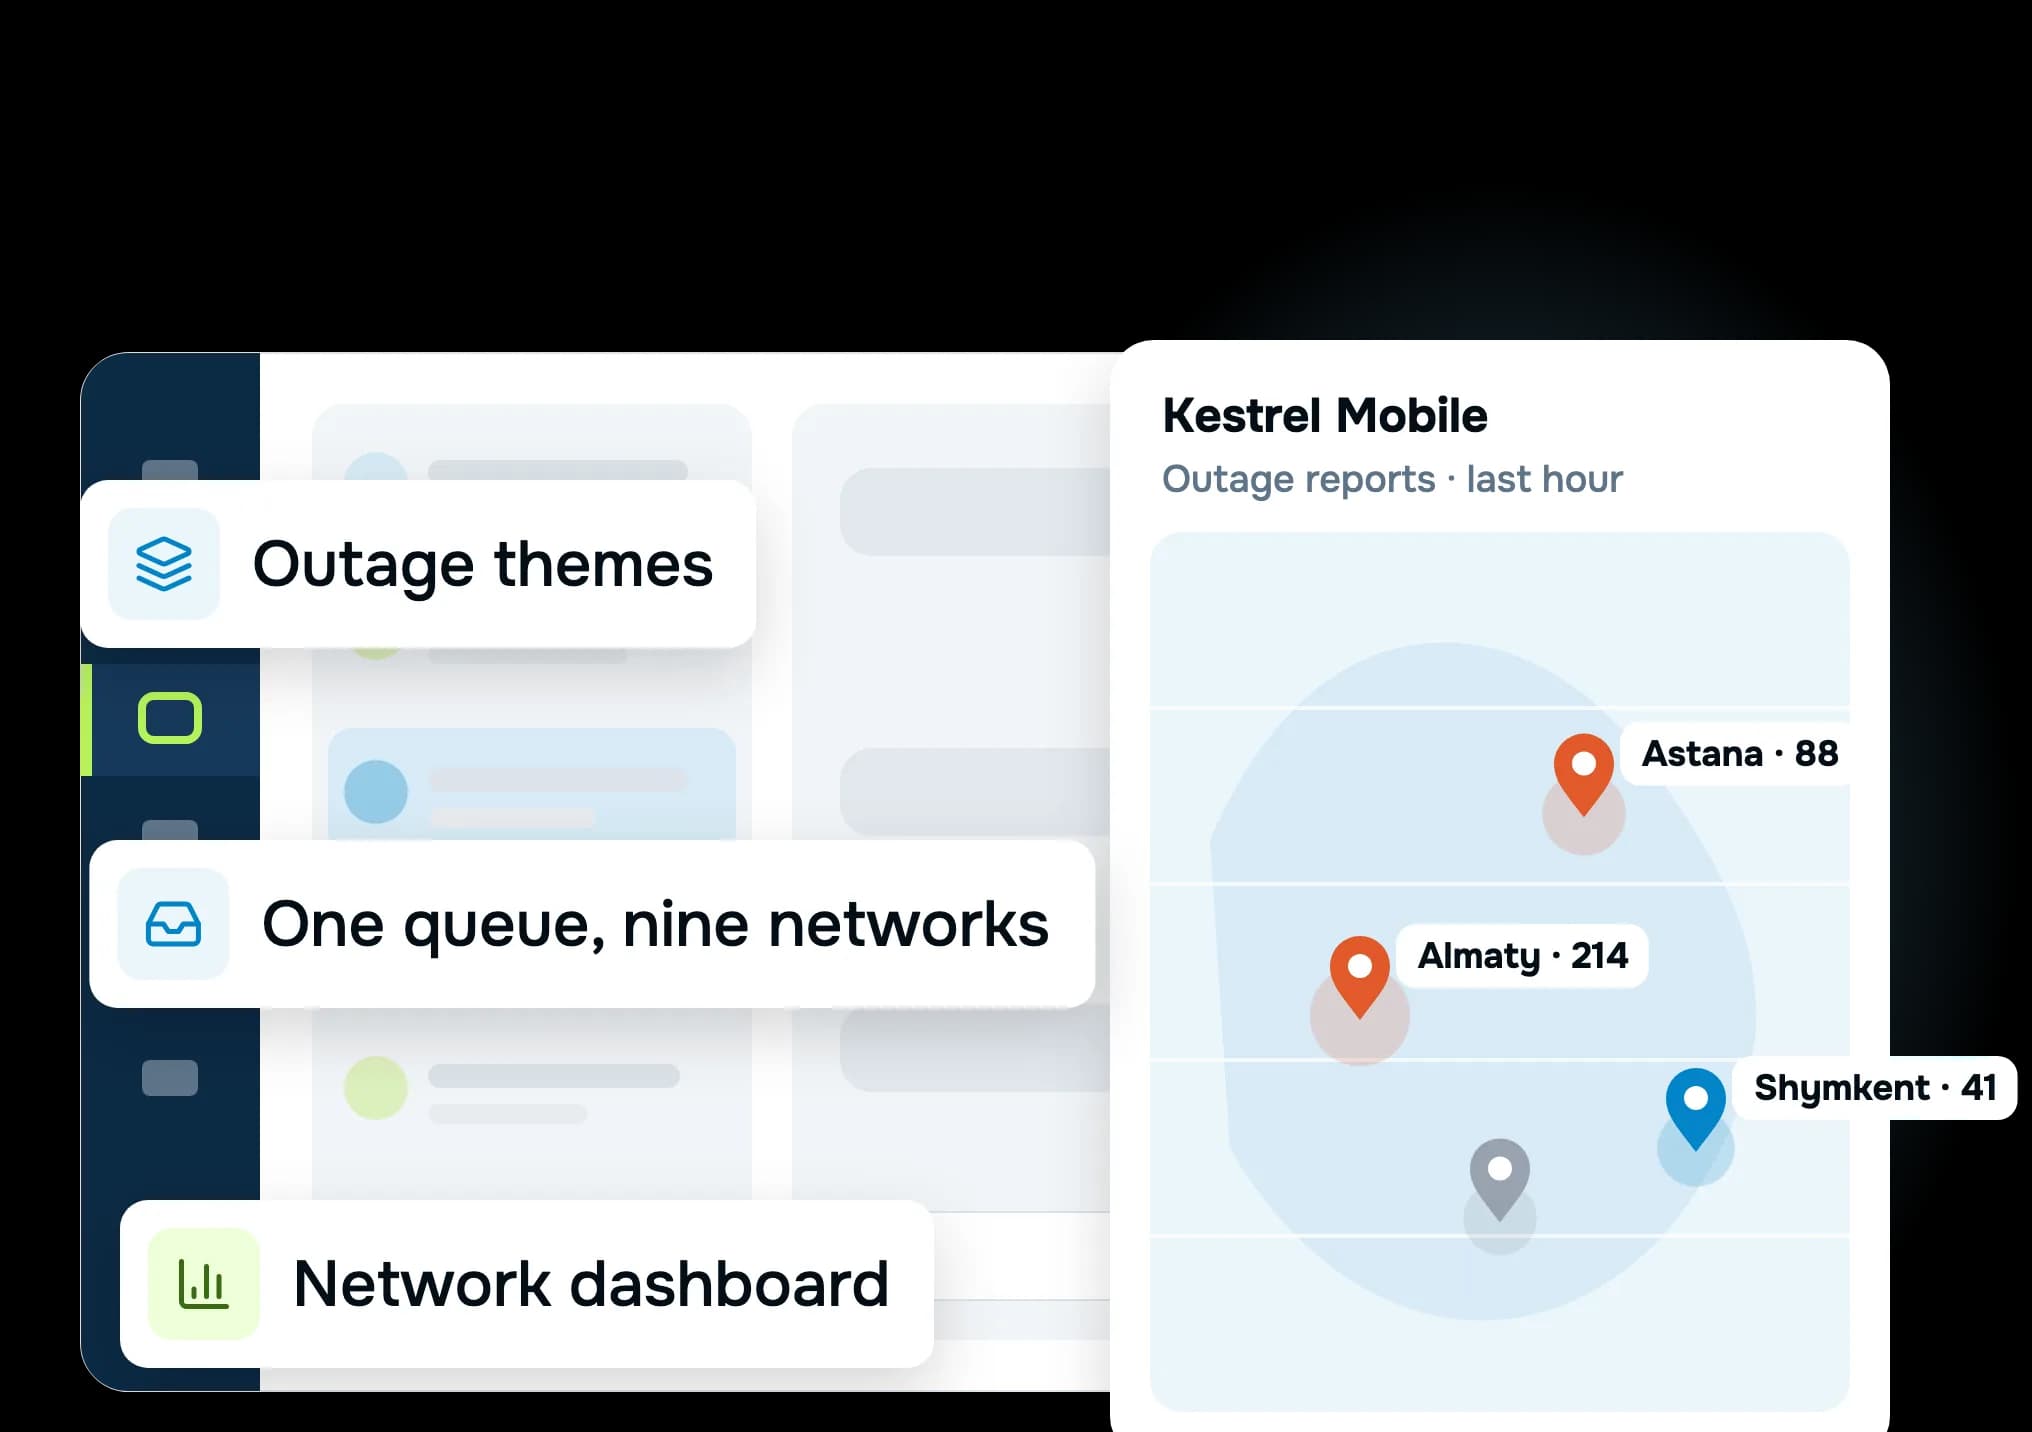
From “something is wrong” to “answered”
Detect it, group it, route it — then measure how long the answer took.
01
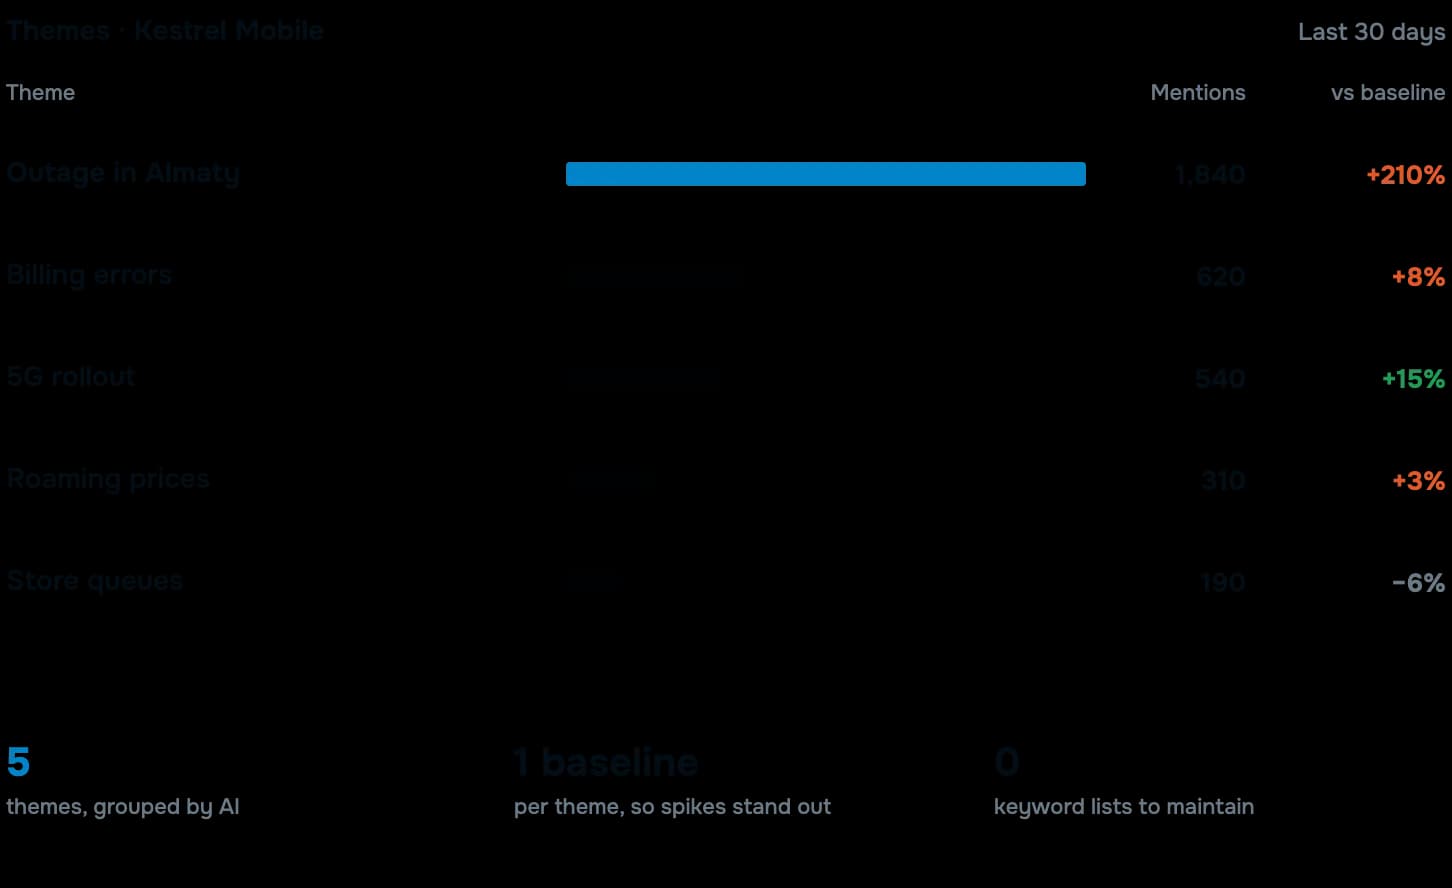
Themes, not a pile of keywords
Posts about the same outage arrive in four languages and a dozen spellings. Scano groups them into one theme, so the spike you see is the incident rather than the search term.
- 01Themes built from your own keyword sets, with stemming per language
- 02Volume and sentiment tracked per theme, against its own baseline
- 03New sub-topics surfaced as subscribers invent new words for the problem
02
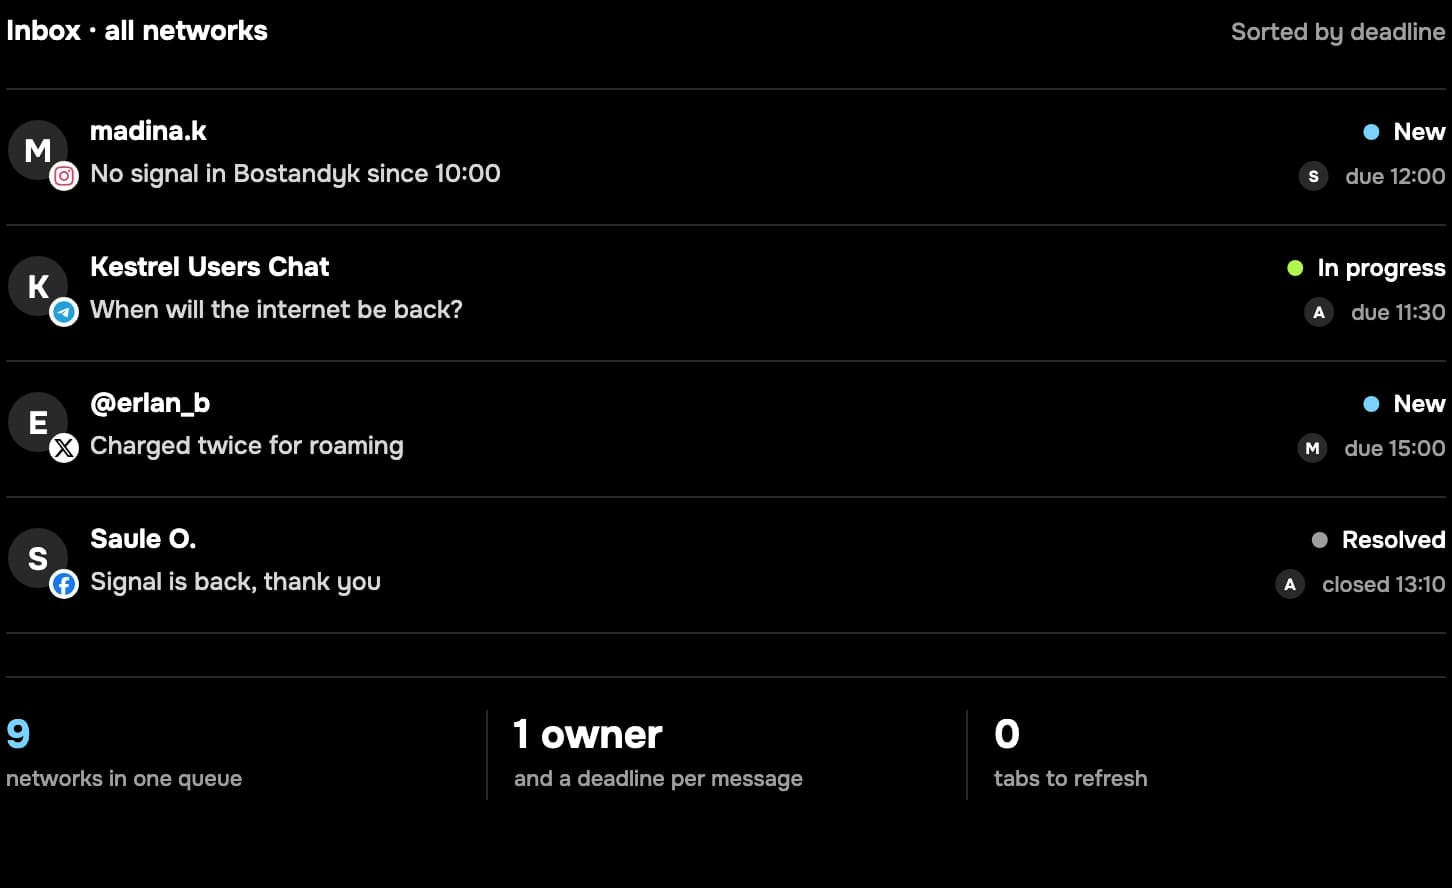
One queue for nine networks
Every complaint, comment and DM lands in the same inbox with a status, an owner and a working-hours deadline — including the comment threads under your own posts.
- 01Assignments, statuses and internal notes per conversation
- 02Approved reply templates in the languages you actually answer in
- 03Response-time measured, with breaches flagged before they are noticed
03
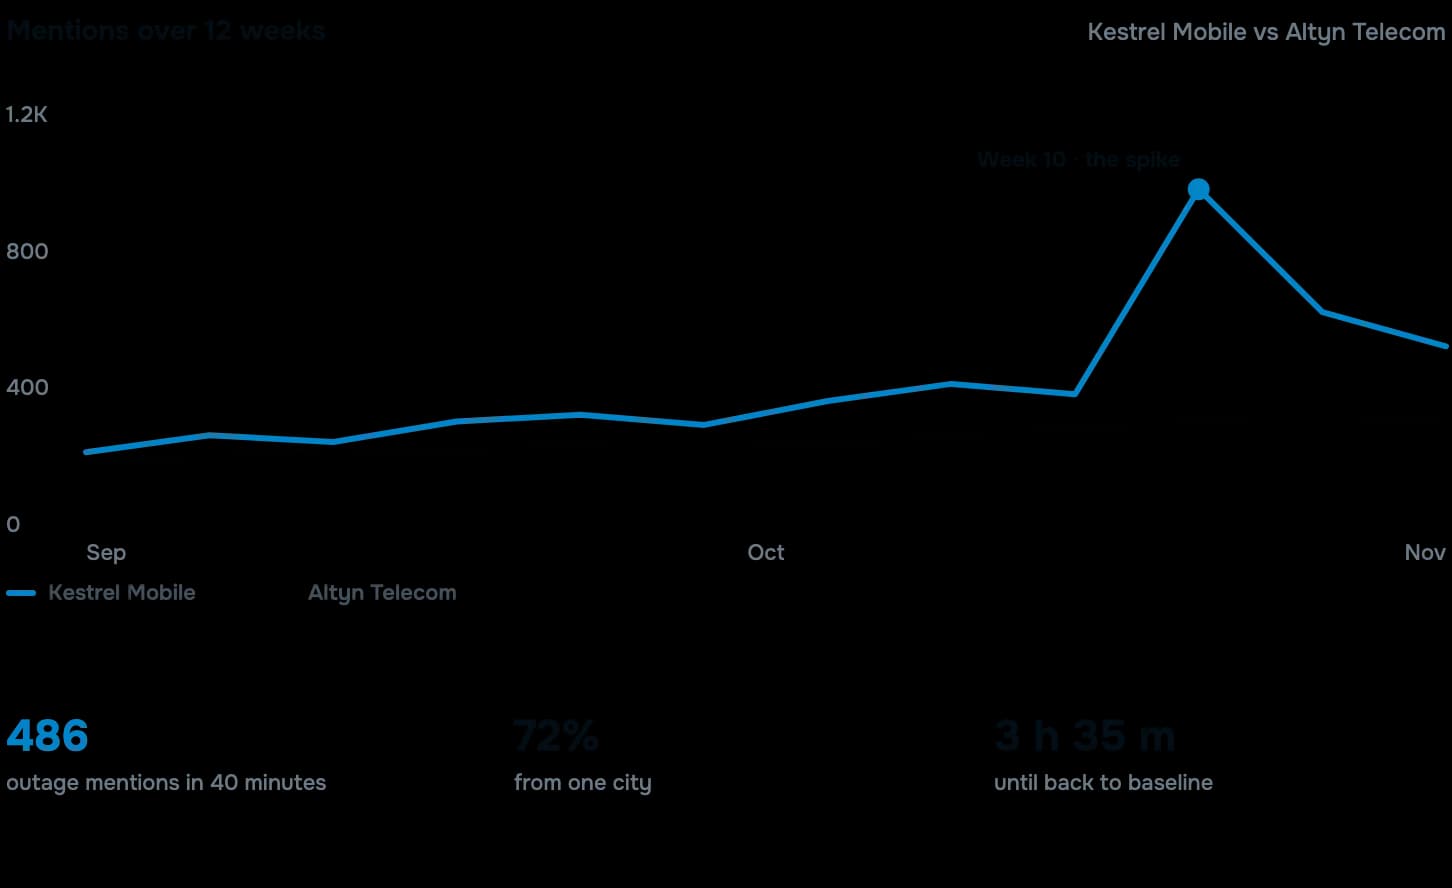
The dashboard the network team will believe
Complaint volume next to sentiment, split by region and by topic, so a coverage argument and a billing argument never get averaged into one flat line.
- 01Region and city breakdowns from the posts themselves
- 02Aspect-level sentiment: coverage, speed, price, support
- 03Scheduled exports for the weekly operations review
What we watch for an operator
Configured around your brand, your tariffs and the districts you serve.
- Outage and “no signal” posts, grouped by region and by district
- Tariff changes, billing disputes and auto-renewal complaints
- Speed and quality arguments, including screenshots of speed tests
- Retail store and call-centre service mentions
- Regulator, ministry and consumer-body statements
- Competitor tariff launches and the reaction to them
What it replaces
The three habits that make an outage look worse than it was.
- Finding out from a journalist that a district has been down since morning.
- Four browser tabs, one per network, refreshed by hand.
- A response-time number nobody can reproduce from the data.
By industry
The rest of the Solutions set
See what Scano finds about your brand
Book a free demo and get advice from a media analyst.
How it works
- A media analyst gets in touch and asks what you need to track.
- We set up monitoring for your brand and competitors.
- We walk you through the results on a live call.
- You get trial access, and we stay on hand for any questions.